Prometheus Client
In a normal prometheus setup we will find prometheus agents which query configured endpoints at regular intervals. The endpoints are HTTP endpoints serving the current metric state in an encoding defined by prometheus.
ZIO Metrics Connectors provides the Prometheus encoding for the captured metrics out of the box. To avoid enforcing a particular HTTP implementation, an instrumented application needs to expose the encoded format as an endpoint with the HTTP server of its choice.
ZIO Metrics in Prometheus
Most of the ZIO metrics have a direct representation in the Prometheus encoding.
Counter
A counter is represented as a prometheus counter.
Metrics.counter("count_all", "The counter description.")
# TYPE count_all counter
# HELP count_all The counter description.
count_all 460.0 1623586224730
Gauge
A gauge is represented as a prometheus gauge.
Metrics.gauge("adjust_gauge", "The gauge description.")
# TYPE adjust_gauge gauge
# HELP adjust_gauge The gauge description.
adjust_gauge -1.2485836762095701 1623586224730
Histogram
A histogram is represented as a prometheus histogram.
Metrics.histogram(
  "my_histogram",
  "My histogram description.",
  MetricKeyType.Histogram.Boundaries.linear(0.0, 10.0, 11)
)
# TYPE my_histogram histogram
# HELP my_histogram My histogram description.
my_histogram{le="0.0"} 0.0 1623586224730
my_histogram{le="10.0"} 8.0 1623586224730
my_histogram{le="20.0"} 18.0 1623586224730
my_histogram{le="30.0"} 30.0 1623586224730
my_histogram{le="40.0"} 44.0 1623586224730
my_histogram{le="50.0"} 51.0 1623586224730
my_histogram{le="60.0"} 59.0 1623586224730
my_histogram{le="70.0"} 65.0 1623586224730
my_histogram{le="80.0"} 76.0 1623586224730
my_histogram{le="90.0"} 88.0 1623586224730
my_histogram{le="100.0"} 95.0 1623586224730
my_histogram{le="+Inf"} 115.0 1623586224730
my_histogram_sum 6828.578655207023 1623586224730
my_histogram_count 115.0 1623586224730
Summary
A summary is represented as a prometheus summary.
Metric.summary(
  "my_summary",
  "The summary description.",
  maxAge = ???,
  maxSize = ???,
  error = ???,
  quantiles = Chunk(0.1, 0.5, 0.9),
)
# TYPE my_summary summary
# HELP my_summary The summary description.
my_summary{quantile="0.1",error="0.03"} 147.0 1623589839194
my_summary{quantile="0.5",error="0.03"} 286.0 1623589839194
my_summary{quantile="0.9",error="0.03"} 470.0 1623589839194
my_summary_sum 42582.0 1623589839194
my_summary_count 139.0 1623589839194
Frequency
A frequency is represented by a set of prometheus counters, distinguished from each other with a label.
val aspSet = Metric.frequency("my_set", "My set description.")
ZIO.succeed("my_key_10") @@ aspSet
ZIO.succeed("my_key_11") @@ aspSet
// etc.
# TYPE my_set counter
# HELP my_set My set description.
my_set{token="my_key_17"} 7.0 1623589839194
my_set{token="my_key_18"} 9.0 1623589839194
my_set{token="my_key_19"} 12.0 1623589839194
my_set{token="my_key_13"} 6.0 1623589839194
my_set{token="my_key_14"} 4.0 1623589839194
my_set{token="my_key_15"} 6.0 1623589839194
my_set{token="my_key_16"} 5.0 1623589839194
my_set{token="my_key_10"} 10.0 1623589839194
my_set{token="my_key_11"} 1.0 1623589839194
my_set{token="my_key_12"} 10.0 1623589839194
Serving Prometheus metrics through HTTP
ZIO Metrics Connectors provides a prometheus client that can be used to produce the prometheus encoded metric state upon
request. The state is encoded and stored in the PrometheusPublisher class. To retrieve the prometheus encoded state,
the application can use the PrometheusPublisher#get method:
val encodedContent: ZIO[PrometheusPublisher, Nothing, String] =
   ZIO.serviceWithZIO[PrometheusPublisher](_.get)
The resulting string can then be used in an HTTP response that has a Content-Type header with value
text/plain; version=0.0.4 (just text/plain works for as long as Prometheus does not define a newer format).
Example HTTP server using zio-http
This section shows some code fragments from the
example application
that is provided in the zio-metrics-connectors repository on GitHub. In the example we
use zio-http (version 3.0.0-RC4) to serve the metrics.
First we define the metrics route:
val prometheusRoute: Route[PrometheusPublisher, Nothing] =
  Method.GET / "metrics" -> handler {
    ZIO.serviceWithZIO[PrometheusPublisher](_.get).map { response =>
      Response(
        status = Status.Ok,
        headers = Headers(Header.Custom(Header.ContentType.name, "text/plain; version=0.0.4")),
        body = Body.fromString(response, StandardCharsets.UTF_8)
      )
    }
  }
We convert the route to an HttpApp and create an HTTP server:
val httpApp = prometheusRoute.toHttpApp
val runHttp = (Server.serve(httpApp) *> ZIO.never).forkDaemon
val serverConfig = ZLayer.succeed(Server.Config.default.port(8080))
Now we can wire everything together in a ZIO app:
object SamplePrometheusApp extends ZIOAppDefault {
  // How often should the prometheus publisher update the response:
  private val metricsConfig = ZLayer.succeed(MetricsConfig(5.seconds))

   override def run: ZIO[Scope, Any, Any] = (for {
      f <- runHttp
      _ <- ZIO.sleep(1.minute) // Your program logic here
      _ <- f.join
   } yield ())
     .provide(
        serverConfig,
        Server.live,

        // The prometheus reporting layer
        metricsConfig,
        prometheus.publisherLayer,
        prometheus.prometheusLayer,

        // Enable the ZIO internal metrics and the default JVM metricsConfig
        // Do NOT forget the .unit for the JVM metrics layer
        Runtime.enableRuntimeMetrics,
        DefaultJvmMetrics.live.unit,
     )
}
Running the full example app
Any of the examples can be run from a command line within the project checkout directory with:
sbt sampleApp/run
Out of the choices, select the option corresponding to sample.SamplePrometheusStatsDApp.
If everything works, we should be able to use a web browser and go to http://localhost:8080/metrics to see something
like:
# TYPE my_counter counter
# HELP my_counter
my_counter{effect="count2"} 46.0 1608982756235
# TYPE set_gauge gauge
# HELP set_gauge
set_gauge 8.66004641453435 1608982756235
# TYPE change_gauge gauge
# HELP change_gauge
change_gauge 90.7178906485008 1608982756235
# TYPE my_counter counter
# HELP my_counter
my_counter{effect="count1"} 92.0 1608982756235
Once we see the metrics being served from our example, we can set up Prometheus and Grafana to create a dashboard displaying our metrics.
Prometheus setup
The following steps have been tested on Ubuntu 18.04 running inside the Windows Subsystem for Linux. Essentially, you need to download the prometheus binaries for your environment and start the server with our sample configuration located at
${PROJECT_HOME}/examples/prometheus/promcfg.yml
This will configure a prometheus job that regular polls http://localhost:8080/metrics for prometheus encoded metrics.
In addition, you need to download the Grafana binaries for your installation, start the Grafana server and configure prometheus as a single data source.
Finally, you can import our example dashboard at examples/prometheus/ZIOMetricsDashboard.json and enjoy the results.
These steps are not intended to replace the Prometheus or Grafana documentation. Please refer to their websites for guidelines towards a more sophisticated setup or an installation on different platforms.
Download and configure Prometheus
In the steps below the project checkout directory will be referred to as $DIR.
- Download prometheus
- Extract the downloaded archive to a directory of your choice, this will be referred to as
$PROMDIR. - Within
$PROMDIRexecuteThis will start the prometheus server which regularly polls the HTTP endpoint of the example above for its metrics../prometheus --config.file $DIR/examples/prometheus/promcfg.yml
Download and configure Grafana
-
Download grafana
-
Extract the downloaded archive to a directory of your choice, this will be referred to as
$GRAFANADIR. -
Within
$GRAFANADIRexecute./bin/grafana-serverThis will start a Grafana server.
-
Now you should be able to login to Grafana at
http://localhost:3000' with the default useradminwith the default passwordadmin`.Upon the first login you will be asked to change the default password.
-
Within the Grafana menu on the left hand side you will find
Manage Dashboardswithin that page, selectImport. -
You can now either install a dashboard from grafana.com or use a text field to paste JSON.
-
Paste the content of
$DIR/examples/prometheus/ZIOMetricsDashboard.jsoninto the text field and selectLoad.This will import our dashboard example.
-
Now, under
Manage Dashboardsthe just imported ZIO dashboard should be visible. -
Navigate to the dashboard.
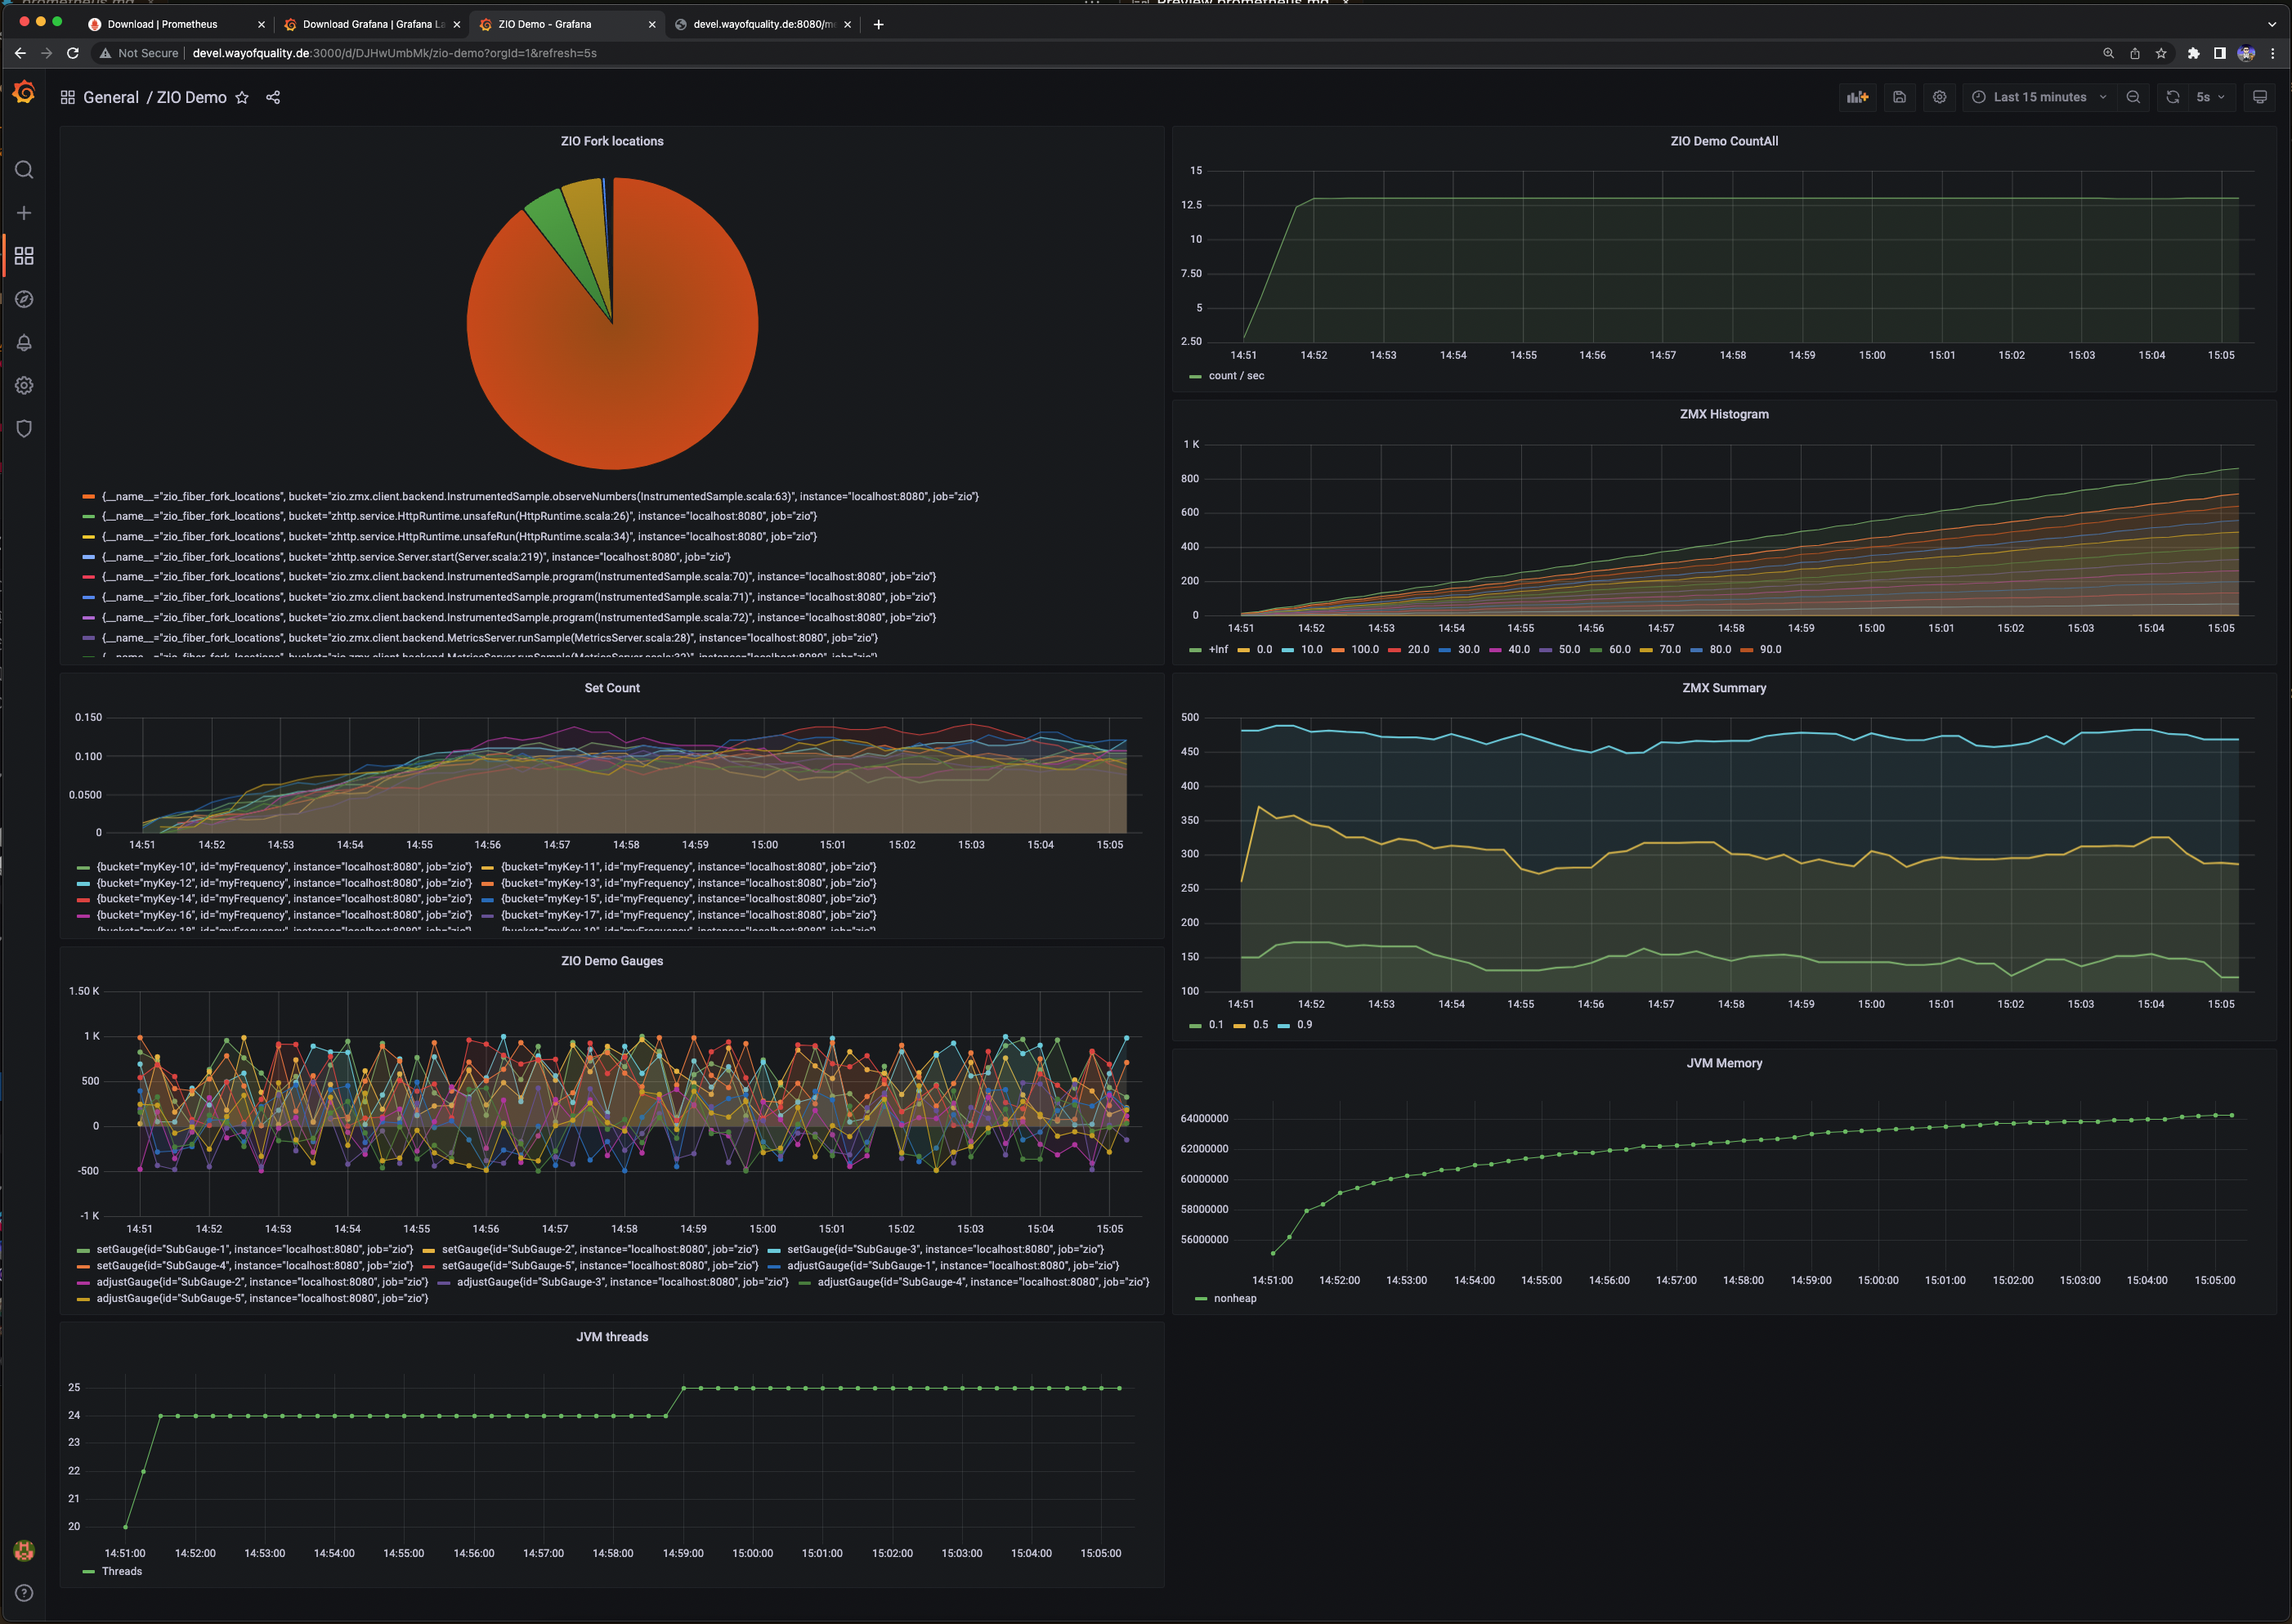
Grafana dashboard
Here is a screenshot of the Grafana dashboard produced with the setup above.