StatsD Client
import zio._
import zio.metrics._
In a normal StatsD setup we will find a StatsD agent with an open UDP port where applications send their metrics to. The format of the metrics is defined in simple datagrams.
With the StatsD client creates the relevant StatsD datagrams and sends them via UDP.
The instrumented code is exactly the as for the Prometheus instrumentation. The only difference is that another client is provided when the App is configured.
ZIO metrics in StatsD
StatsD normally has its own definition how histograms and summaries are configured. In the default setup this is defined in the config file of the statsd agent. Furthermore, a StatsD Histogram is more or less the equivalent of a Prometheus summary.
However, whenever the desired quantiles need to change, the config must be adjusted and the agent restarted.
Therefore, the client maps the more complex metrics to a set of related gauges. This allows us to achieve the same visualization without the need to adjust any of the agents config files.
Counter
Upon the change of a counter a datagram is sent with the delta to the previous value reported.
countAll:1|c
Gauge
Whenever a gauge changes, a datagram with the current absolute value of the gauge is reported.
adjustGauge:32.2787317766752|g
Histogram
A histogram is reported in a datagram built from related gauges. The individual records share the same name
and the buckets are encoded in an extra label le.
myHistogram:0|g|#le:0.0
myHistogram:3|g|#le:10.0
myHistogram:6|g|#le:20.0
myHistogram:10|g|#le:30.0
myHistogram:13|g|#le:40.0
myHistogram:16|g|#le:50.0
myHistogram:19|g|#le:60.0
myHistogram:22|g|#le:70.0
myHistogram:24|g|#le:80.0
myHistogram:27|g|#le:90.0
myHistogram:29|g|#le:100.0
myHistogram:37|g|#le:Inf
Summary
A summary is also reported as a set of related gauges. Each quantile will be reported within its own gauge.
The additional labels are quantile to address the quantile and error to display the configured error margin.
mySummary:123|g|#quantile:0.1,error:0.03
mySummary:254|g|#quantile:0.5,error:0.03
mySummary:441|g|#quantile:0.9,error:0.03
Sets
Sets are also reported as sets of related gauges. An additional label is used to differentiate the distinct values in the set. The name of the label is as configured in the aspect used to capture the set.
mySet:6|g|#token:myKey-18
mySet:1|g|#token:myKey-19
mySet:2|g|#token:myKey-13
mySet:3|g|#token:myKey-14
mySet:1|g|#token:myKey-16
mySet:3|g|#token:myKey-10
mySet:2|g|#token:myKey-11
mySet:1|g|#token:myKey-12
The ZIO Metrics StatsD example
import java.net.InetSocketAddress

import zio._
import zio.console._
import zio.metrics.connectors.statsd.statsdLayer

import sample.InstrumentedSample

val instrumentedSample = new InstrumentedSample() {}
For StatsD we do need to spin up our own server. Rather we need to provide a client that can send datagrams to a specified UDP destination.
Again we need an effect that runs our instrumented code until the user presses any key:
val execute =
  for {
   fiber <- instrumentedSample.program.fork
    _ <- putStrLn("Press Any Key") *> getStrLn.orDie
    _ <- fiber.interrupt
  } yield ExitCode.success
Now, we can override the run method of our ZIO App and simply provide a StatsDListener.
def run(args: List[String]): URIO[ZEnv, ExitCode] =
  execute.provideCustomLayer(statsdLayer).orDie
It is a listener because it listens to changes in the ZIO Metrics internal state and reports them to StatsD by sending out appropriate datagrams.
A simple StatsD / Datadog setup
The following steps describe how to set up a ZIO Metrics application reporting to Datadog using a free Datadog account with limited functionality. The local setup is Windows 10 with WSL and Docker installed running Ubuntu 18.04 within WSL.
In principle the setup is as follows:
- The ZIO application sends datagrams to
localhost:8125via UDP, so we need a component picking up those datagrams. - Run a Datadog Collector within a docker image exposing a Unix socket for datagrams.
- Run
socatto listen on the UDP socket 8125 and forward incoming traffic to the Unix socket. - Configure a dashboard in Datadog to visualize the metrics.
Get and run the docker based Datadog collector
Upon registration with datadoghq.com you will get an API key which is required to configure the agents collecting data. If you are planning
to experiment with different agents, take a note of your API key for further reference. In the steps below the API key will be referred to
as $APIKEY
For our example we have chosen to use the docker based collector and use a unix socket to report our datagrams to that agent.
You can start the agent from the command line with
docker run --name dd-agent -e DD_API_KEY=$APIKEY -e DD_SITE=datadoghq.eu \
  -e DD_DOGSTATSD_SOCKET=/var/run/datadog/datadog.sock \
  -v /var/run/datadog:/var/run/datadog \
  -v /var/run/docker.sock:/var/run/docker.sock:ro \
  datadog/agent
As you can see, we require that the directory /var/run/datadog exists so that we can use it as a volume within the agent's docker container. The environment variable DD_DOGSTATSD_SOCKET tells the agent to use a unix socket to listen for datagrams. The socket file must reside within the mounted volume.
This will start the datadog collector within docker and we have a unix socket to report our datagrams to.
The next step is to create a UDP socket where our application can report its datagrams to. For our example we have chosen socat to forward
UDP traffic to our unix socket:
sudo socat -s -u udp-recv:8125 unix-sendto:/var/run/datadog/datadog.sock
You could add the
-vparameter to the socat call to run socat in verbose mode. That would print all traffic being forwarded to the console as well. This is useful to determine whether datagrams are actually sent.
Run the Datadog example
Now, the Datadog example can be started from within the project checkout directory with
sbt sampleApp/run
Visualize the metrics
- Log in to your datadog account
- From the menu on left hand side select `Dashboards/New Dashboard'
- In the upper right corner, click on the dashboard settings and select 'Import Dashboard JSON'
- From the filesystem, select
$DIR/examples/statsd/ZIOMetrics.json - Confirm to override the dashboard configuration
- Save the just imported dashboard
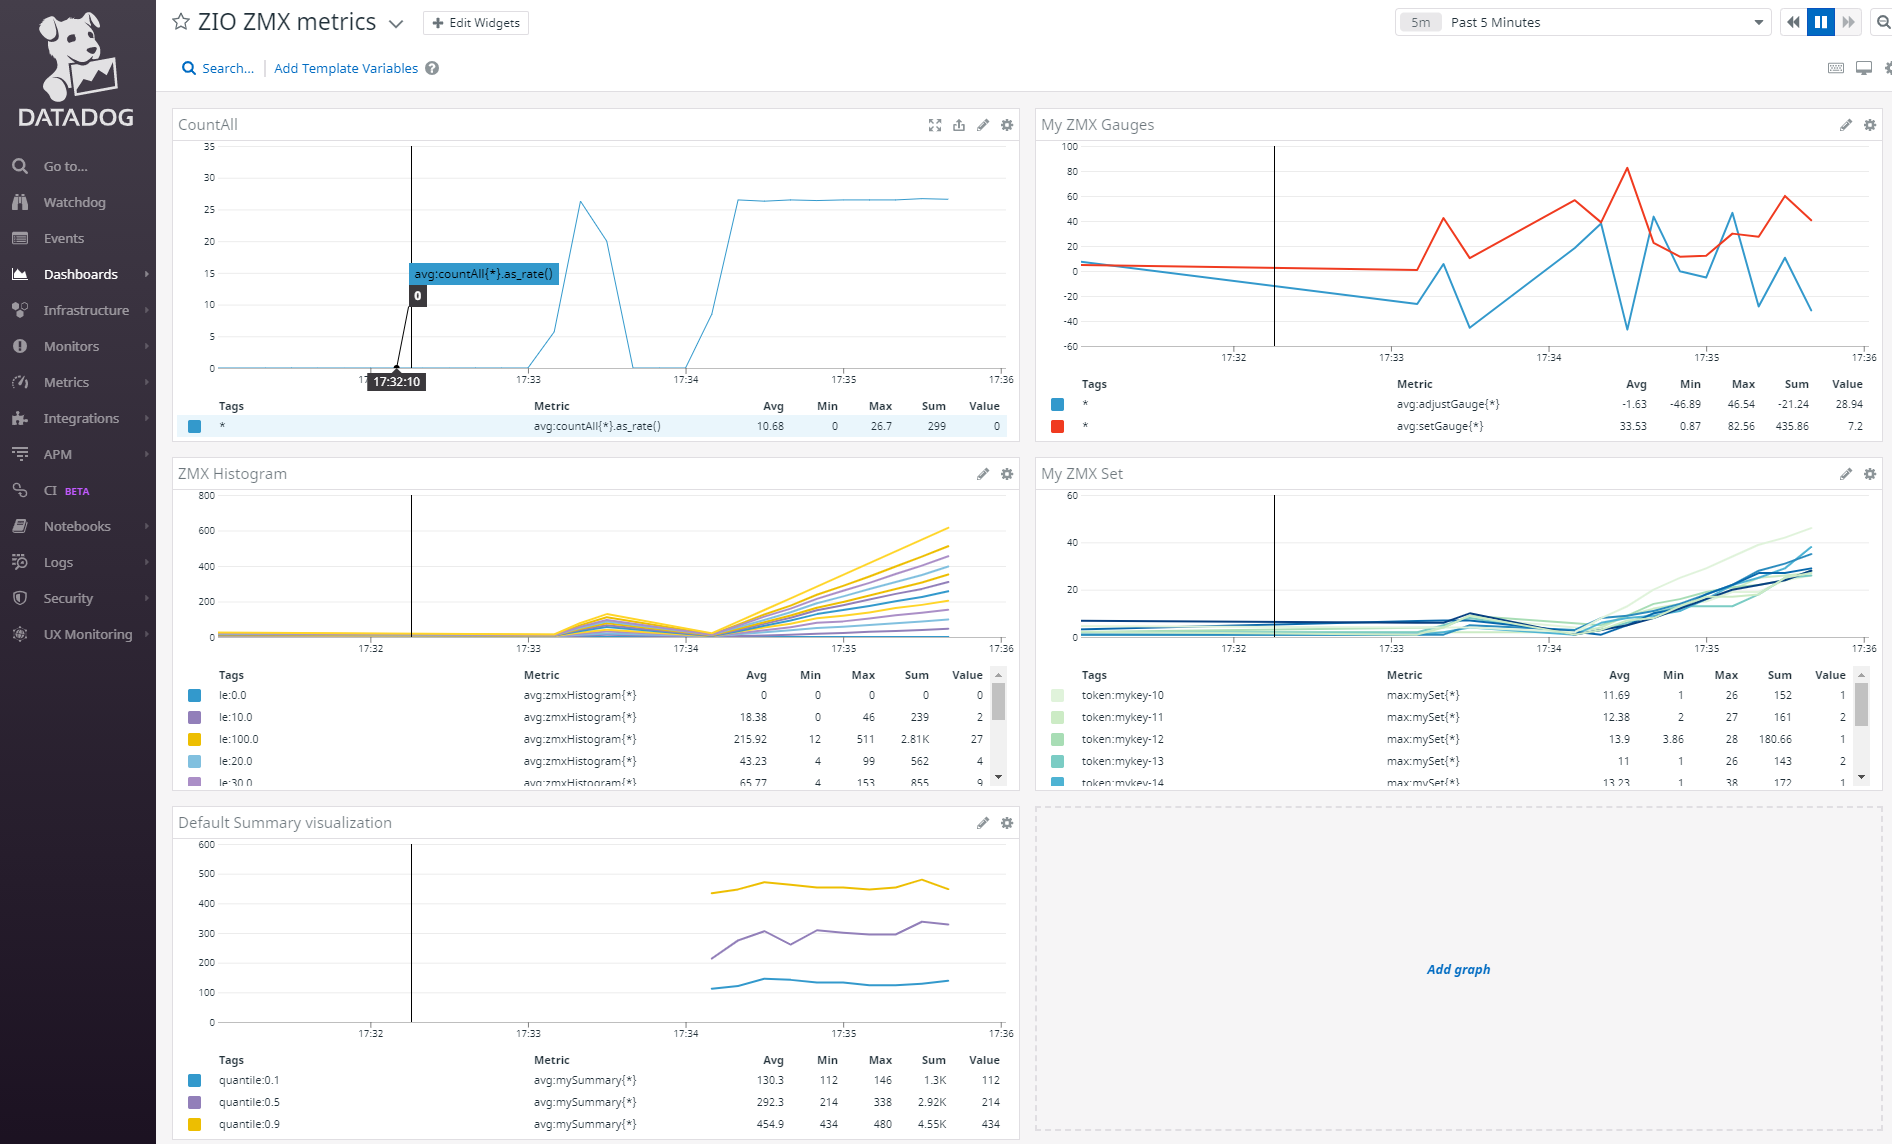
- From the dashboard list select ZIO metrics
- The Datadog dashboard is displayed
Datadog dashboard